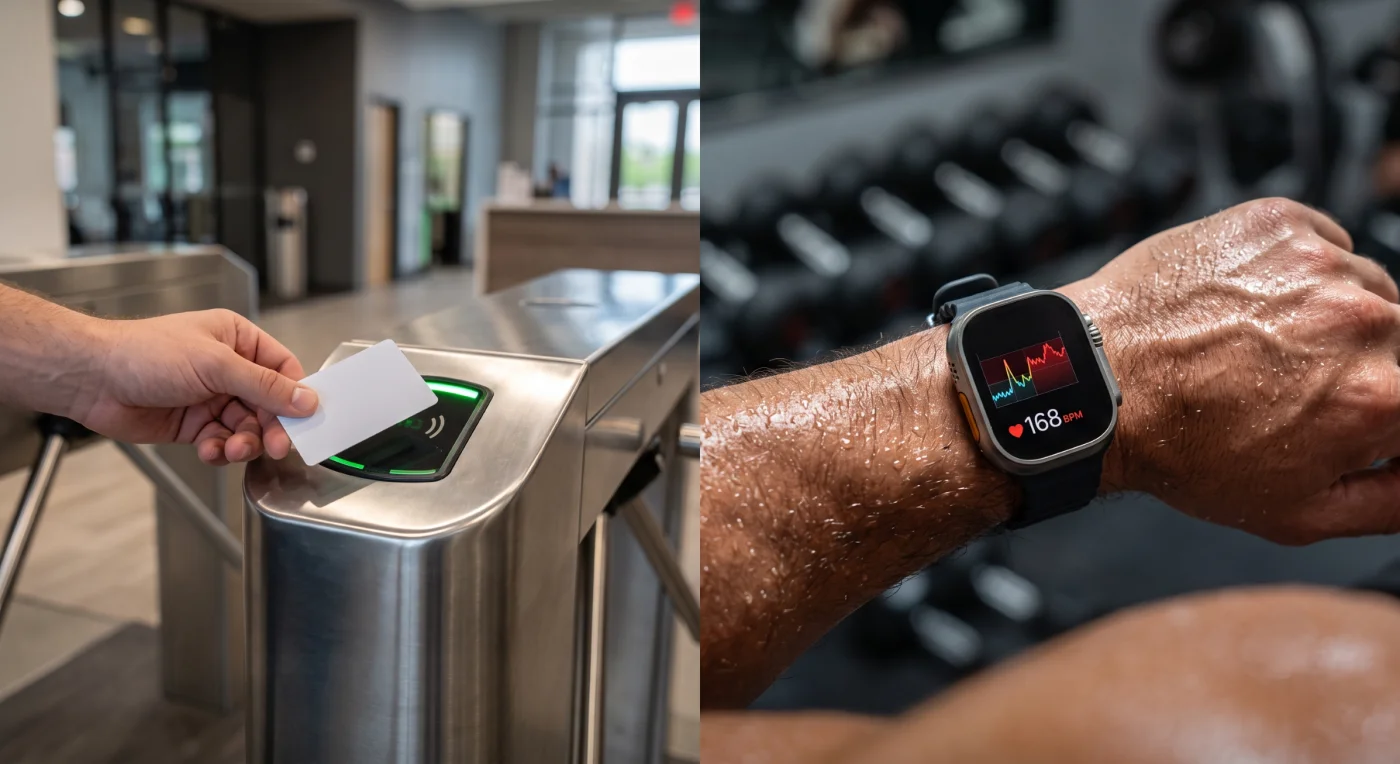
Are you measuring the swipe of the card, or the actual sweat? The difference between SaaS vanity metrics and authentic cognitive growth.
If you are building a Mentor archetype venture, where your core promise to your users is Competence, you might ask yourself: how do we know our users are actually learning something?
Alternatively, this might not be your own initiative, but a requirement from your investors or buyers. They need proof that what you are building actually makes a difference.
So, what metrics do you use? This topic can become overwhelming, as it’s easy to confuse the data you normally collect for software-as-a-service valuation (e.g., daily active users or session length) with the data required to validate cognitive development.
This is especially true now that educational technology has moved far beyond static digital textbooks and simple learning management systems. At the heart of modern EdTech is event-driven development: an approach that treats every interaction, click, submission, and message as an event that can be captured, processed, and turned into an insight or action.
The first step for an event-driven platform is deciding what events to track and how to represent them in a consistent schema. You might be tempted to log absolutely everything, but a mindless approach leads to noise, high storage costs, and privacy concerns. Worse, it often leads you to measure the wrong things entirely.
What does your gym tracker track?
Think of it as a gym tracker. If it tracks the number of times you swipe your entry card at the gym turnstile and encourages you with a Streak gamification mechanic, does that mean you are becoming fitter every time you check in?
No. In fact, you can easily "game" it by swiping your card, buying a smoothie, and sitting in the lobby doomscrolling. And who can blame you? This is simply what the human brain does – it finds the path of least resistance to secure the reward.
In EdTech, there are three types of behavioural signals you can track.
Tier 1: the vanity metrics ("swiping the gym card")
These are the most common and frequently misinterpreted data points in the sector – consumption and output metrics. The top are:
- Passive media consumption. You are not automatically learning something just because a video is playing in the background, regardless of the minutes logged, right?
- Completion rates. Show that your content was clicked through or viewed until the end; that’s it.
- Quiz scores. Provide point-in-time performance indicators, proving that you can recall something from short-term memory (especially if the quiz instantly follows the content).
- Gamified metrics. XP points, streaks, and leaderboard rankings are fantastic platform health and engagement indicators. But do they indicate that you produced any cognitive effort or acquired a skill?
All of these measure compliance, attendance, and surface-level engagement.
High engagement does not equal high learning; pedagogically, these metrics are shallow.
Furthermore, they encourage students to "game the system" by exploiting mechanics (like rapidly clicking through hints) to bypass cognitive work and get to the extrinsic rewards fast, whilst still appearing highly engaged on the teacher’s dashboard.
Gamification can be a very powerful tool, but you must know how to use it correctly. Done wrong, it can undermine a student’s intrinsic motivation to learn.
Tier 2: the process metrics ("measuring the sweat")
This tier tracks the learner’s journey: their behavioural nuances and how they interact with the material, serving as a high-fidelity proxy for cognitive engagement.
Usability discipline teaches us to detect and remove friction. But behavioural UX teaches us to see the forest for the trees: sometimes, we must purposefully introduce friction.
If you think about learning or mastering a new skill, it is all about friction because learning is hard.
A gym workout is not working if it doesn’t make you sweat. In the same way, learning requires the brain to "sweat" as it forms new neural pathways. Here is how you can measure that brain sweat – your leading indicator of learning:
- Retry and self-correction. Measuring the latency (pause) before the next attempt allows you to distinguish whether a student is pausing for thoughtful reconsideration or just rapid-fire guessing.
- Path choices and navigation metrics. Do they access optional hints, review previous material, or select a non-linear progression?
- Physical actions. Question-asking, highlighting text, or annotating digital materials are powerful indicators of active sense-making.
However, friction must be handled with care to avoid user churn caused by overwhelm and discouragement. They need to stay within a state of "desirable difficulty." You must target the zone of proximal development where the struggle remains productive, distinguishing it from unproductive "wheel-spinning."
Tier 3: the outcome metrics ("building the muscle")
This tier is the gold standard because it attempts to quantify actual changes in a learner’s cognitive architecture, focusing on the durability, flexibility, and mastery of knowledge.
What this looks like:
- Testing the retention of knowledge over time. Achieved through delayed assessments (not immediate quizzes).
- Evaluating the transfer of knowledge. Providing a student with a challenge to apply a concept to a novel, unpractised problem.
- Using algorithms to quantify mastery growth. Continuously calculating the mathematical probability that a student truly understands a concept based on their entire history of errors, hints, and successes.
These metrics go far beyond what was memorised for a quiz today; they measure what learners genuinely understand.
Audit your dashboard
Relying solely on Daily Active Users will not be enough to secure your next round of funding or land your next pilot programme. To stand out, you must demonstrate undeniable evidence of pedagogical efficacy.
- Are you rewarding passive behaviour (watching a video), or constructive behaviour (synthesising notes in their own words)?
- Are your streaks transforming a learning pursuit into a transactional exercise of logging in and doing the bare minimum?
- Is your telemetry a "data swamp" for surveillance, or does it translate raw data into actionable insights for the learner and teacher?
If you are optimising solely for the swipe of the card, it is time to start measuring the sweat and muscle growth.